This article is part of the CakeDC Advent Calendar 2025 (December 3th 2025)
Every application has a heartbeat. CPU usage spikes, database queries slow down, memory fills up, queues back up. These things happen all the time, but we usually only notice them when something breaks. By then, it's too late. You're in firefighting mode, users are complaining, and you're digging through logs trying to figure out what went wrong.
I built Rhythm because I was tired of this reactive approach. I wanted to know what my applications were doing before they fell over. I wanted to catch slow queries before they became a problem. I wanted to see which endpoints were struggling before users started reporting errors. Basically, I wanted to understand my application's heartbeat.
Installing Rhythm (skie/rhythm) takes just one Composer command. After running the migrations to create the necessary database tables, you're ready to start monitoring your application.
To ensure continuous monitoring and accurate, up-to-date metrics, you'll want to run the Rhythm digest and check commands on a schedule. These commands are designed to be triggered by a cron job or as persistent background services. The rhythm check command collects server and system metrics periodically, while rhythm digest processes and aggregates ingested metrics for your dashboards and widgets. Setting them up as recurring tasks means your monitoring remains real-time and accurate, even as your load changes. For most installations, adding them to your server's crontab (or running as a systemd service) is all it takes to get ongoing insight into application performance with zero manual intervention.
The Philosophy Behind Rhythm
Most monitoring tools fall into two camps. Either they're incredibly simple and only show you basic metrics, or they're enterprise monsters that require a dedicated team to configure and maintain. I wanted something in between. Something that would give me real insights without drowning me in complexity.
Rhythm is designed around a simple idea: capture what matters, aggregate it efficiently, and show it in a way that makes sense. It doesn't try to do everything. It focuses on the metrics that actually help you understand your application's performance and health.
The plugin automatically monitors servers, tracks HTTP requests, catches slow database queries, monitors your queue system, logs exceptions, and watches background jobs. All of this happens automatically once you install it. No complex configuration, no manual instrumentation of every single endpoint.
How It Actually Works
Rhythm uses a two-phase approach that solves a fundamental problem with PHP monitoring. PHP runs and dies. A request comes in, PHP processes it, sends a response, and terminates. This makes it tricky to collect and aggregate metrics because there's no long-running process to accumulate data.
The ingest phase happens during your normal request cycle. Rhythm collects metrics in memory as your application runs. When the request finishes, it dumps these metrics into a persistent queue, either in your database or in Redis. This is fast and doesn't slow down your responses.
The digest phase processes the queued metrics into final storage with automatic aggregation. This happens separately, either as a scheduled job or a daemon process. It takes all those individual metric points and aggregates them into useful summaries. How many requests per minute? What was the average response time? Which queries were slowest?
This separation means your application stays fast while still collecting detailed performance data. The heavy lifting happens outside the request cycle, so users never feel the monitoring overhead.
The Dashboard Experience
The Rhythm dashboard lives at the rhythm route in your application. When you open it, you immediately see what's happening across your infrastructure. Server performance metrics show CPU, memory, and disk usage for all your servers. Queue statistics show how many jobs are waiting, processing, and failing. Recent exceptions appear with their frequency and locations.
What makes this useful is the real-time aspect. The dashboard updates live as new data arrives. You can watch your application breathe. You see patterns emerge. That endpoint that spikes CPU every hour? You'll spot it. The query that only becomes slow under certain conditions? It'll show up.
The dashboard is built with CakePHP's view system, so customizing it feels natural. Want to add a custom widget? Create a class that extends BaseWidget, write a template, and drop it in the dashboard layout. Want to change the layout? Just edit the template file. No JavaScript rebuilds, no complex build processes.
Monitoring What Matters
The servers recorder captures system-level metrics. It monitors CPU usage, memory consumption, and disk space across all your servers. This runs as a background daemon using the rhythm check command, taking snapshots at regular intervals. If you run multiple servers, each one reports its own metrics, and you see them all in the dashboard.

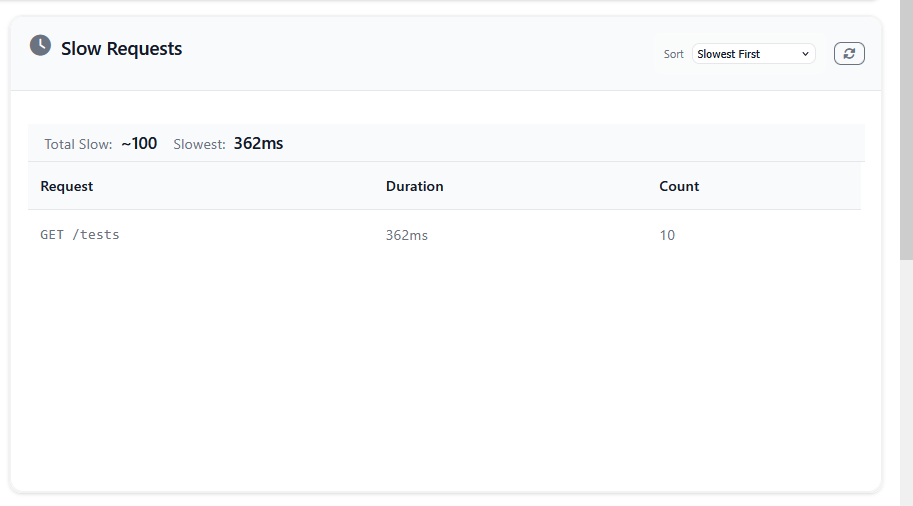
Request monitoring happens automatically. Every HTTP request gets logged with its response time, memory usage, and status code. Slow requests above your configured threshold get flagged for special attention. You can see which endpoints are struggling, which users are making the most requests, and where your performance bottlenecks are.
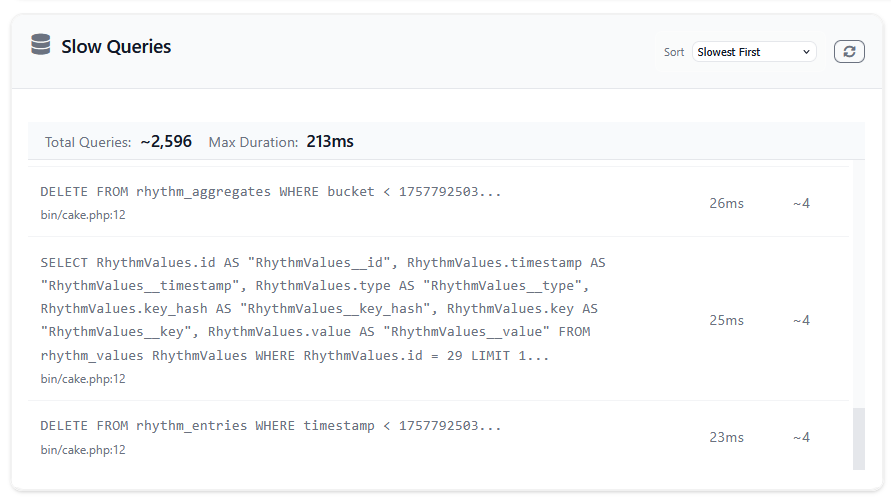
Database monitoring watches your queries. Any query that exceeds your threshold gets logged with its SQL, execution time, and location in your code. This is incredibly useful for finding N+1 queries or identifying queries that only become slow under certain data conditions. The slow queries widget groups similar queries together so you can see patterns rather than drowning in individual slow query instances.
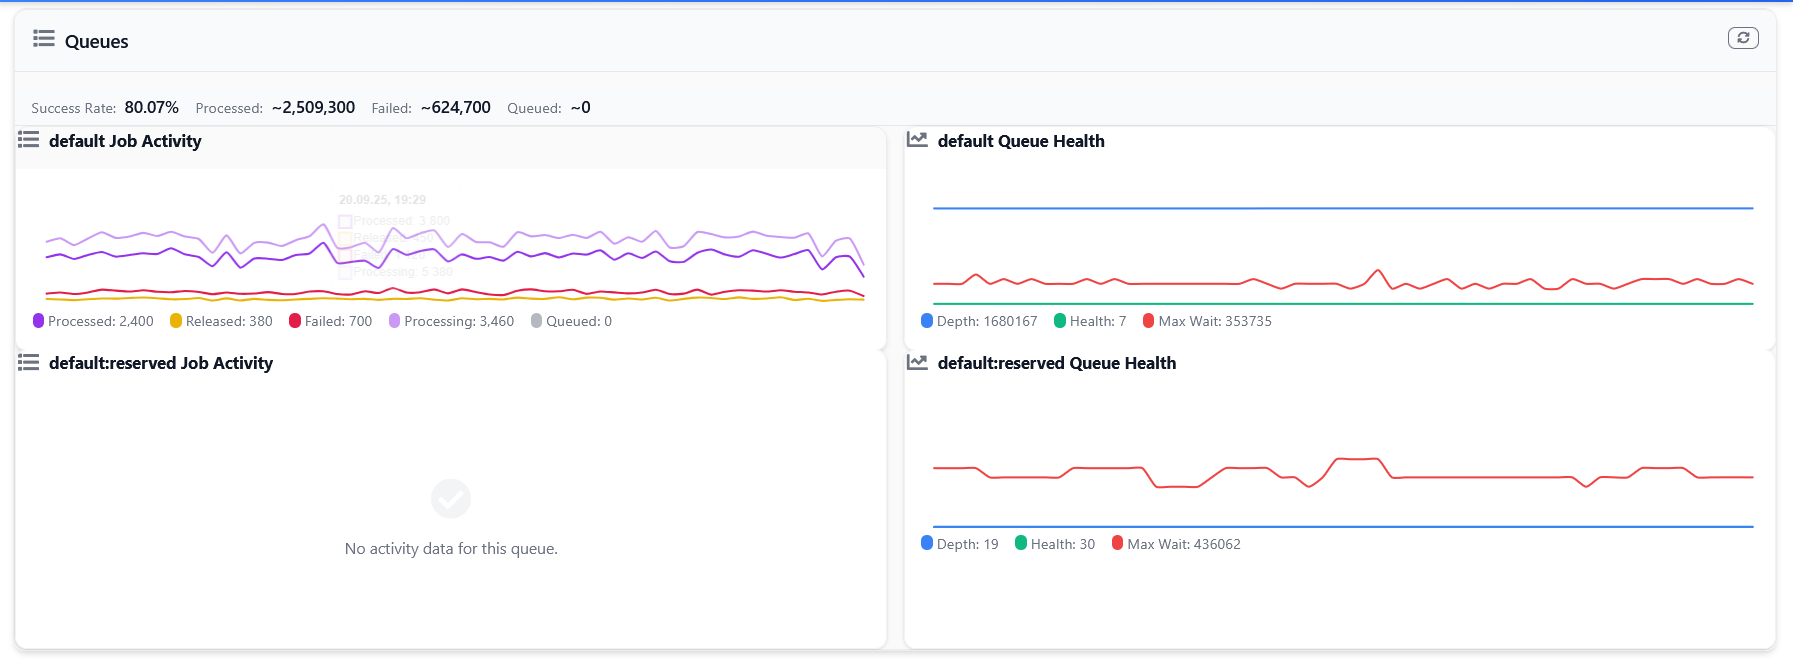
Queue monitoring integrates with CakePHP's queue system. It tracks how many jobs are queued, how many are processing, how many succeeded, and how many failed. The queues widget shows this as a time series, so you can see if your queues are backing up or if your workers are keeping up with the load.
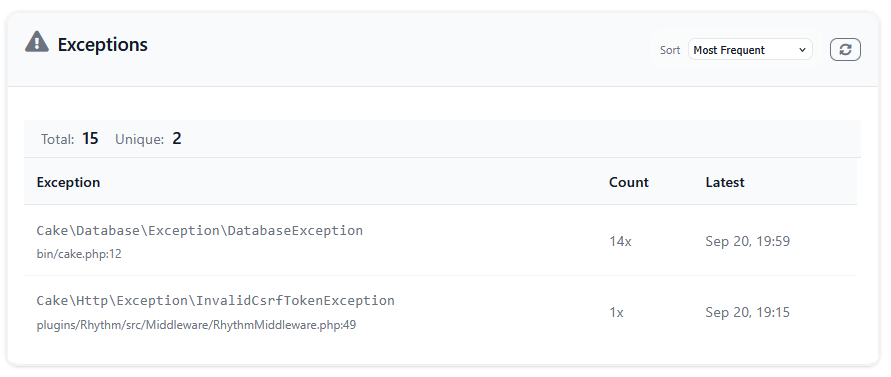
Exception tracking captures every exception your application throws. It groups them by exception class and location, showing you which errors are most common and which are most recent. This gives you a quick overview of what's going wrong in your application without diving through log files.
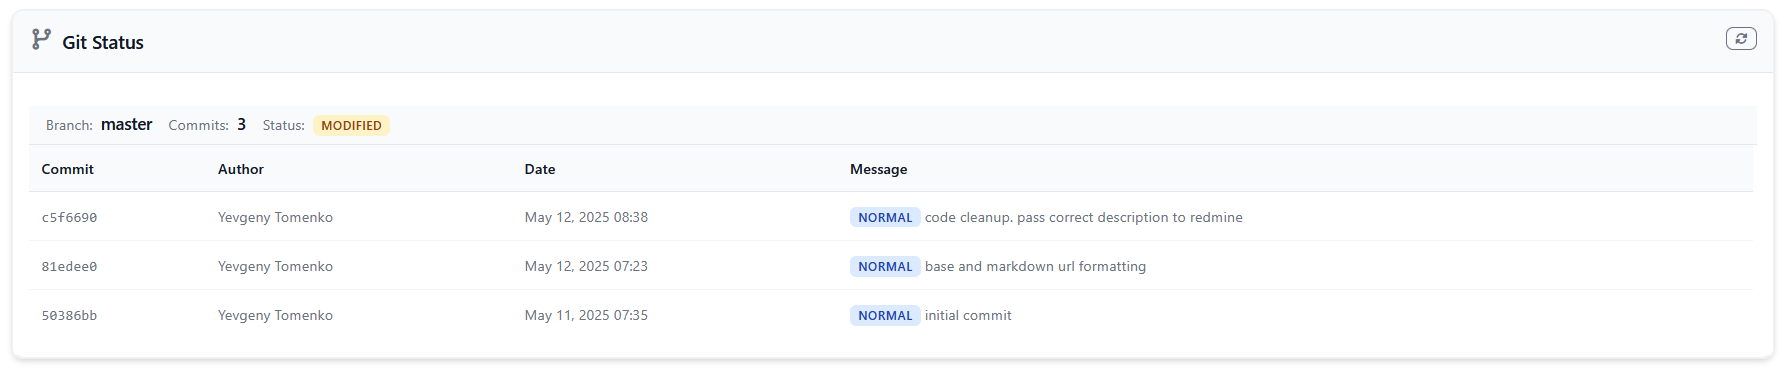
The Git Widget
One feature I find myself using constantly is the Git widget. It shows your current branch, recent commits, and repository status right in the dashboard. This seems simple, but it's incredibly useful when you're troubleshooting.
You deploy a change, and suddenly exceptions start appearing. Was that commit really deployed? What branch is production running? What were the recent changes? The Git widget answers these questions immediately. No need to SSH into servers or check deployment logs.
The widget automatically categorizes commits as features, fixes, docs, tests, or other based on the commit message. It extracts ticket numbers and merge information. It even shows tags and version numbers. All the context you need to understand what code is actually running.
Redis and Database Monitoring
For applications that rely heavily on Redis or specific databases, Rhythm includes specialized monitors. The Redis monitor tracks memory usage, key statistics, evictions, and network traffic. The MySQL monitor watches connections, InnoDB metrics, and query performance. The PostgreSQL monitor tracks similar database-specific metrics.
These monitors run on an interval, capturing snapshots of your database or cache server's health. You see trends over time. Is Redis memory usage growing? Are database connections maxing out? These are the kinds of problems you want to catch before they cause outages.
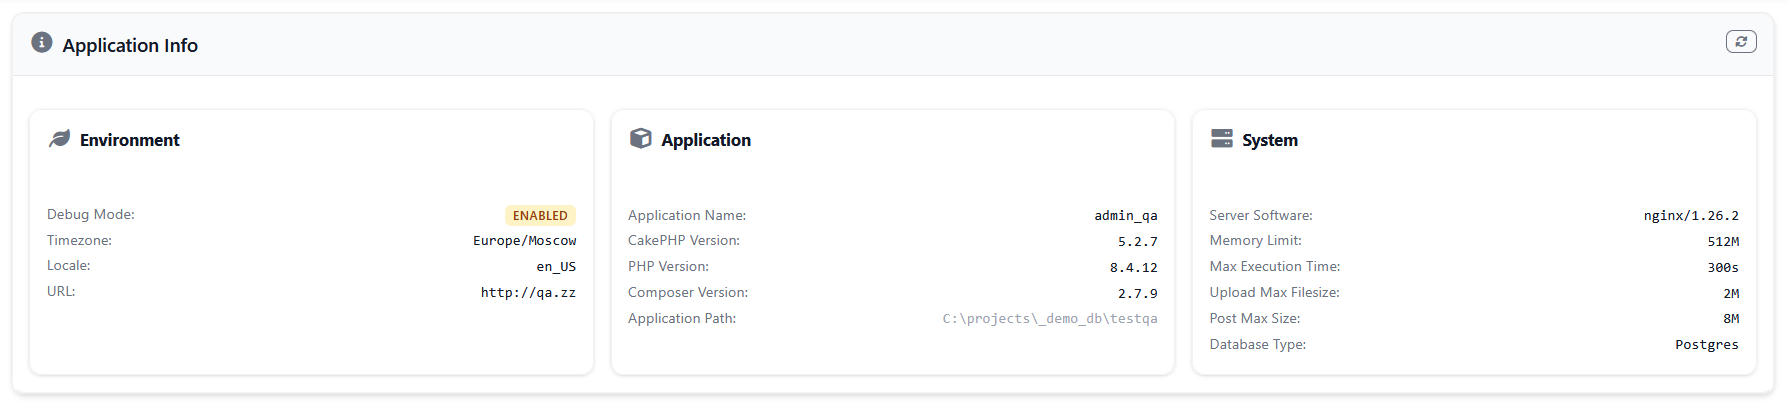
Application Info
The App Info widget displays comprehensive application information including CakePHP version, PHP version, debug mode status, system configuration, and database information. This widget provides a quick overview of your application's environment and configuration.
Performance Considerations
Monitoring adds overhead. There's no way around it. But Rhythm is designed to make that overhead negligible. The sampling system lets you monitor only a fraction of events while still getting accurate insights. If you're getting 10,000 requests per minute, you probably don't need to record every single one. Sample 10% of them, and Rhythm automatically scales the numbers in the dashboard.
The aggregation system is efficient because it pre-computes summaries during the digest phase. When you load the dashboard, it's not calculating averages or counting records on the fly. It's reading pre-computed aggregates that update periodically. This makes the dashboard fast even with millions of metric data points.
Using Redis for ingestion is faster than writing to the database during every request. The metrics get queued in Redis, and the digest process pulls them out in batches. If you're on a shared database or your database is already under load, Redis ingestion can make a real difference.
The Null Driver
During testing or development, you might not want any monitoring overhead at all. The null ingest driver discards all metrics silently. You can leave all your Rhythm calls in place, but nothing gets recorded. This is perfect for running tests quickly or for development environments where you don't care about metrics.
Switch back to the database or Redis driver in production, and all those metrics start flowing again. No code changes needed.
Real Problems, Real Solutions
I've used Rhythm to solve real problems in production applications. One application was experiencing random slowdowns. The slow requests widget showed they were all hitting the same endpoint. The slow queries widget revealed that endpoint had a query that only became slow when a certain condition was true. Fixed the query, problem solved.
Another application was running out of disk space on its database server. The server state widget showed disk usage climbing steadily. Investigation revealed old Rhythm entries weren't being trimmed properly. Configured the trim settings correctly, and the problem stopped.
A third application had intermittent Redis memory issues. The Redis monitor showed periodic spikes in memory usage corresponding to background jobs running. Turned out some jobs were caching too much data. Adjusted the caching strategy, and Redis stabilized.
These aren't dramatic stories, but that's the point. Rhythm helps you catch and fix problems before they become dramatic. It gives you visibility into what your application is actually doing, and that visibility makes debugging so much easier.
Configuration and Setup
Getting Rhythm running is straightforward. Install the plugin via Composer, run the migrations to create the database tables, and load the plugin in your Application class. That's the minimum setup.
The configuration file lets you enable or disable specific recorders, adjust sampling rates, and configure storage options. Most of the defaults are sensible, so you can start with minimal configuration and adjust as you learn what metrics matter for your application.
If you want to monitor multiple servers, run the rhythm check command on each one. If you're using Redis ingestion, run the rhythm digest command to process queued metrics. Both of these are long-running commands meant to run as daemons, so you'll want to use Supervisor or systemd to keep them running.
Closing Thoughts
Monitoring shouldn't be complicated. You shouldn't need to be a DevOps expert to understand what your application is doing. You shouldn't need to set up complex infrastructure just to know if your servers are healthy.
Rhythm gives you that visibility with minimal setup and maintenance. It captures the metrics that matter, shows them in a dashboard that makes sense, and stays out of your way. It's monitoring that feels natural in CakePHP, using conventions you already know.
Install it, glance at the dashboard occasionally, and you'll develop an intuition for what normal looks like in your application. When something changes, you'll notice. When something breaks, you'll have the data to understand why. That's what monitoring should be.
Your application has a heartbeat. Rhythm helps you hear it.
This article is part of the CakeDC Advent Calendar 2025 (December 3th 2025)
